A practical backend scaling note on database bottlenecks, connection pooling, caching, and measuring before optimizing.
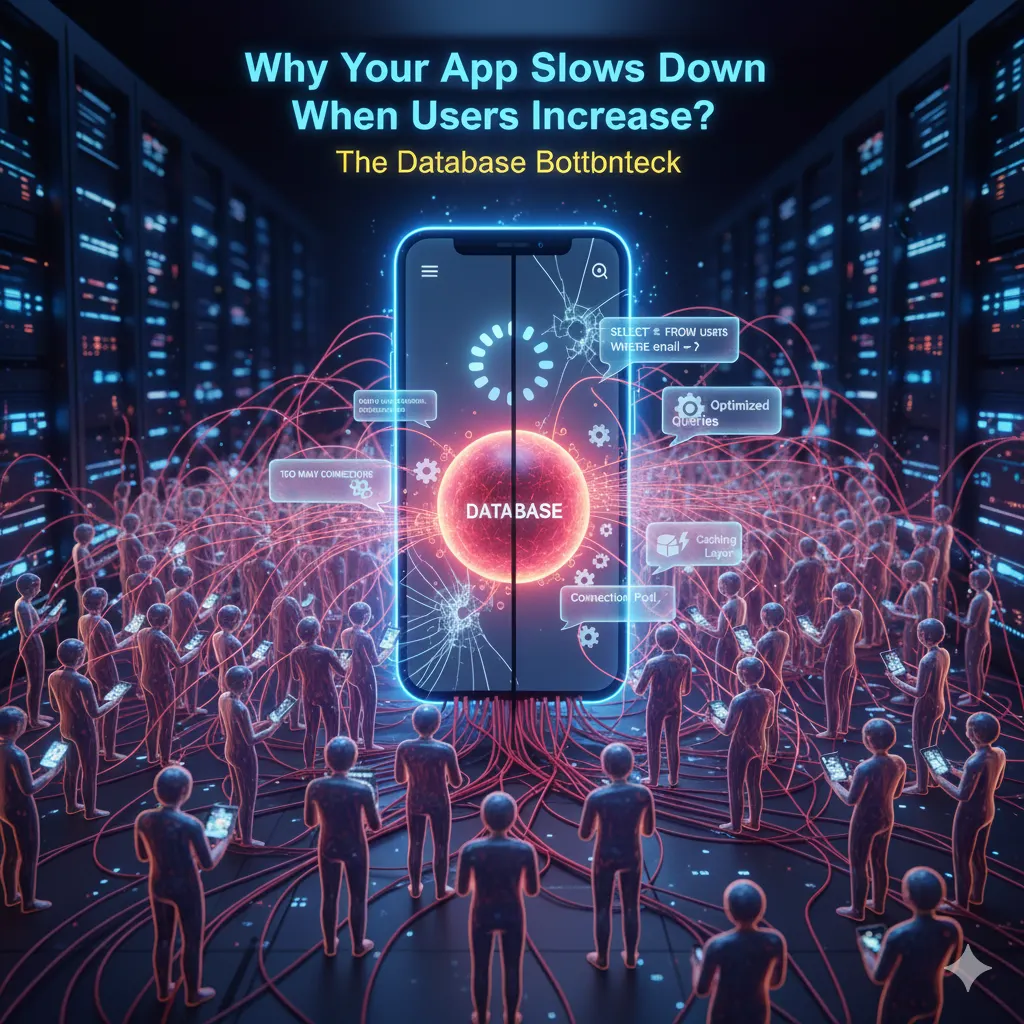
Every backend developer eventually faces the same moment, the app works fine locally, but as soon as traffic increases, everything slows down. Requests take longer, CPU spikes, and database queries take longer.
Several issues can contribute to this slowdown. Database bottlenecks are the most common culprit, the application spends time waiting for queries to execute, and slow queries, unindexed columns, or too many concurrent connections can quickly pile up under load. Inefficient code, such as nested loops or synchronous tasks, can block the server from processing other requests.
While network latency, resource exhaustion such as maxed-out CPU, memory, or file descriptors can prevent the server from handling concurrent users efficiently. Finally, external dependencies, like third-party APIs or payment gateways, may introduce unpredictable delays.
Among all these factors, the most immediate and impactful area to address is the database: optimizing queries, indexes, and connections typically delivers the largest performance improvements before tackling other bottlenecks.
1. The Root Cause: The Database Is Often the Bottleneck
Most web apps are I/O-bound — they spend time waiting for the database. When user count rises, even simple operations like
SELECT * FROM users WHERE email = ? can start piling up.
Why this happens?
- Unindexed columns → full table scans.
- Too many open connections → Database( eg: PostgreSQL) connection pool exhaustion.
- Chatty applications → multiple small queries per request instead of one efficient one.
- Lack of caching → repeated reads for the same data.
2. The Myth Of Scaling Up
The first instinct is often to increase CPU or memory on your database. This helps briefly, but vertical scaling has limits and cost penalties. The real fix is to optimize access patterns.
- Use indexes on frequently filtered
- Batch queries or use
JOINs instead of looping - Introduce connection pooling
- Implement caching
3. Query Optimization 101 : Indexing
Before adding Redis or Kafka, understand how to analyze your SQL. Almost every junior backend developer knows ‘indexing makes faster’ but do you know the actual performance difference it creates? Lets find out!
Example (PostgreSQL):
I have created a simple table big_users to display the difference in query performance before and after indexing.
INSERT INTO big_users (email, full_name, created_at, last_login, bio)
SELECT
  'user' || gs::text || '@example.com',
  'User ' || gs::text,
  now() - (gs % 365) * interval '1 day',
  now() - (gs % 30)  * interval '1 day',
  repeat('lorem ', (gs % 10))
FROM generate_series(1, 1000000) AS gs;
You can use EXPLAIN query to check the performance.
EXPLAIN ANALYZE
SELECT * FROM big_users WHERE email = '[email protected]';
The results will be somewhat crude but you will see something along the lines that says ‘seq scan’ in the results which indicates no index was used to read the table.
Gather
  cost=0.00..20582.33, rows=1, width=84
  Workers Planned: 2
  Workers Planned: 2

Parallel Seq Scan on big_users
  (cost=0.00..20582.33 rows=1 width=84)
  (actual time=33.422..33.422 rows=0 loops=3)
  Filter: email = '[email protected]'
  Rows removed by filter: 333,333 (per worker slice; total table scanned)

Planning Time: 0.099 ms
Execution Time: 183.282 ms
What it means?
- The table was scanned sequentially, but in parallel with multiple nodes. The table is split into page ranges; each worker scans its chunk.
- The planner expected ~1 matching row, with about 84 bytes per row output from this node.
- (loop = 3) The node was executed 3 times — that’s the leader + 2 parallel workers. “Workers Planned/Launched: 2”, so 2 workers plus the leader process = 3 executions.
- Total execution time took around 183ms.
TLDR: No index on email, so Postgres scanned the table in parallel with multiple nodes; the full table pass took ~183 ms.
It shows Seq Scan, you need an index.
CREATE INDEX idx_big_users_email ON big_users (email);If you are sure that emails are unique like it is for our case you can also create unique index like:
CREATE UNIQUE INDEX idx_big_users_email_unique ON big_users (email);For now I have just created non-unique index but remember. Creating index might take couple of seconds.
If you again execute the same query:
EXPLAIN ANALYZE
SELECT * FROM big_users WHERE email = '[email protected]';
You will see something like this:
Index Scan using idx_big_users_email on big_users
(cost=0.42..8.44 rows=1 width=84)
(actual time=0.079..0.080 rows=1 loops=1)

Planning Time: 0.360 ms
Execution Time: 0.104 ms
You can see that it scanned using index that we created earlier and the execution time took only 0.104ms! That is around 1700 times faster.
The difference between a sequential scan and an indexed lookup can be thousands of times faster.
4. Connection Pooling
Before you think about horizontal scaling or adding replicas, understand how your application talks to your database.
Every request that needs data opens a connection and PostgreSQL doesn’t like thousands of idle or concurrent client connections. For example: A single Node.js process can open too many concurrent DB connections under load. PostgreSQL doesn’t handle thousands of idle clients well.
Lets explore “Pooling” and understand why unpooled connections can crash your database.
Single Client
In many simple applications, each server instance maintains a single client connection to the database. This works fine in low-traffic situations. For example, if you deploy 50 server instances, each with one client, the total number of connections to PostgreSQL is 50, usually below PostgreSQL’s default max_connections limit.
However, there’s a subtle but important limitation: a single client can only handle one query at a time. If multiple requests hit the same server instance simultaneously, they must wait for the single client to become available. This creates an artificial bottleneck at the application level, increasing latency even when the database itself is capable of handling more work.
Why Pooling Helps
A connection pool maintains a small set of reusable database connections for each server instance. For example, a pool of 10 connections allows up to 10 queries to run concurrently on a single instance. Once a query finishes, the client returns to the pool and becomes available for the next request.
- With 50 server instances × 10 connections per pool, you now have 500 concurrent connections which is far more efficient than creating a new client per request.
- Requests can now execute concurrently without waiting for a single client to finish, reducing latency and improving throughput.
- The database remains stable under load, avoiding the crash risks associated with too many idle or blocked connections.
Even on high-end machines, a single client can become a bottleneck under concurrent load. Connection pools enable concurrency within each server instance, allowing a single powerful machine to fully utilize its capacity.
When Multiple Clients Are Needed
While a single client per instance can suffice in some cases, there are scenarios where multiple clients or multiple pools are required:
- High concurrency per instance — If your server handles many simultaneous requests that each make independent queries, one client cannot process them in parallel. A pool ensures each query gets its own connection.
- Multiple databases or privileges — Sometimes, an application needs to connect to different databases or use different credentials. In such cases, multiple clients or pools are necessary.
- Long-running queries — A single client executing a long-running transaction blocks all other queries. With a pool, other requests can borrow free connections and continue without waiting.
Here is a simple pool using pg.Pool;
import { Pool } from "pg";

const pool = new Pool({
  host: "localhost",
  user: "postgres",
  password: "postgres", // do not hardcode
  database: "testdb",
  max: 10, // only 10 physical connections
});

const getUser = async (id: number) => {
  const result = await pool.query("SELECT * FROM users WHERE id = $1", [id]);
  return result.rows[0];
};
Even if your app handles 10,000 concurrent requests, only 10 actual connections are active to PostgreSQL . The rest wait in the queue.
This drastically improves database stability.
What is PgBouncer? It is a small connection pooler that sits between your application and PostgreSQL, holding a fixed number of real database connections and handing them out to clients per transaction or per session. Use it when you run many app instances, each with its own pool, and the sum of those pools still exceeds what PostgreSQL can hold; PgBouncer collapses them into one bounded set on the database side.
5. Caching: Your Best Friend
Not every query needs to hit the database.
- In-memory cache: Fastest, but lost when instance restarts.
- Distributed cache: Redis or Memcached, for sharing across instances.
- Query-level cache: Cache the result of slow queries (e.g., popular products, user profile).
const key = `user:${userId}`;
let user = await redis.get(key);
if (!user) {
  user = await db.query('SELECT * FROM users WHERE id = $1', [userId]);
  await redis.setex(key, 60, JSON.stringify(user)); // cache for 60s
}
return JSON.parse(user);
6. Observability: Measure Before You Optimize
You can’t fix what you don’t measure. Use metrics, tracing, and logging to find bottlenecks.
Tools to start with:
- pg_stat_statements (PostgreSQL query stats)
- Prometheus + Grafana (metrics dashboards)
- OpenTelemetry (distributed tracing)
- k6 (load testing)
7. Final Thoughts
Scaling isn’t magic, it’s discipline.
Before adding Kafka, Redis, or microservices, understand your database. Once you fix slow queries, pool connections, and cache effectively, you’ll be surprised how far a single well-tuned PostgreSQL instance can scale.
Takeaway: Scaling isn’t about complexity, it’s about efficiency.